
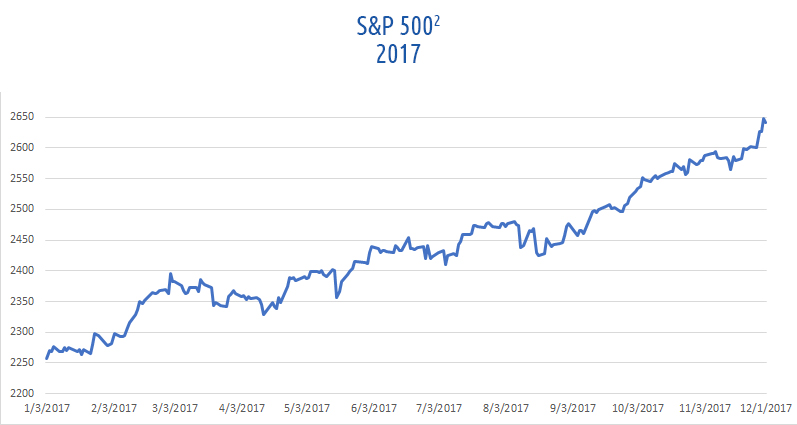
Since January 1st, 2017, the S&P 500 is up 21.25%1, spurred higher by unexpectedly strong company earnings, hopes of a more business-friendly regulatory environment, and tax cuts which have perpetually remained just over the horizon. Without a doubt, the last year has been great for investors who stayed the course and remained invested through the volatile 2016 election cycle.
In the world of financial planning, it is critical for us to consider the long game. By this we mean the macro trends in the U.S. stock market which can take years, or even decades, to develop fully. While we can take away valuable lessons from shorter time horizons, these short “snapshots” are, many times, just noise.
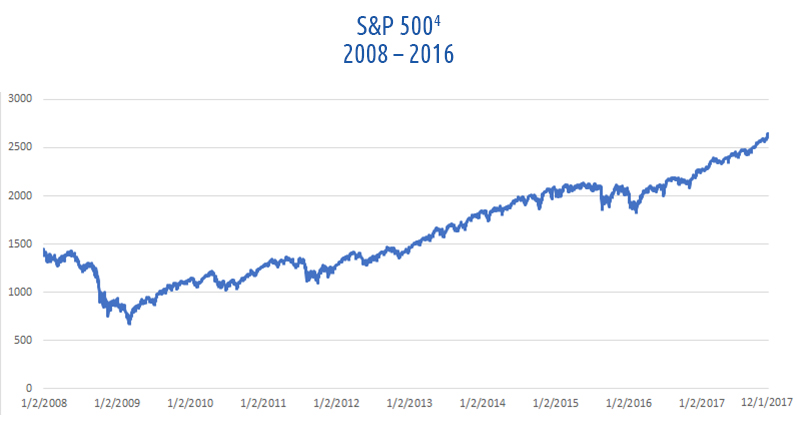
If we take a step back and look at U.S. markets since 2008, it is clear that the last 12-month period of market moves has just been a continuation of the largest bull market in U.S. history. Since finding a bottom in March of 2009, the S&P 500 has more than tripled3 in value following America’s “Great Recession.” Once again, it has been a great decade for investors who stayed the course and remained invested through the 2008 financial crisis.
Looking at these two time horizons, a clear pattern of events starts to take shape: turmoil occurs, stock markets decline, the dust settles, and U.S. equity markets continue to move higher. We have seen this play out time and time again, yet selling during pullbacks or aggressively buying near market highs are two of the biggest reasons why individual investors continue to underperform major stock market indices5. Take a moment to consider how you responded during the 2016 election, or when Lehman Brothers collapsed in 2008. It’s not fun to think about sometimes, but both are valuable points in time for investors to reflect on.
Here’s our last and longest snapshot to consider: the S&P 500 since 1871. As we are looking so far back, it’s important that we adjust for inflation. One dollar could buy significantly more goods in 1871 than it can today, so it’s important that we account for this change rather than just considering the price in dollars of the Index over time.
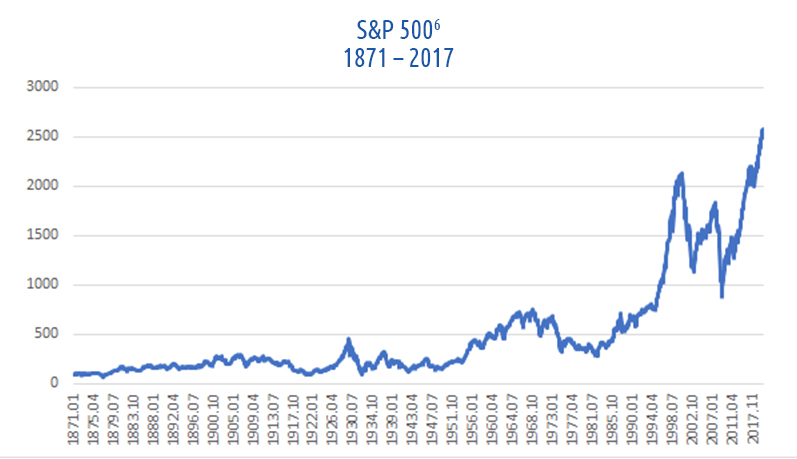
Over this time period, U.S. equity markets have seen five distinct periods of significant and sustained growth: 1924 through 1928, 1951 through 1966, 1985 through 2000, 2002 through 2008, and 2009 through present day. Every period, except for 2009 to present, has seen a major pullback mark the end of the run.
There aren’t many sure bets in the investment world, but another market correction is something that all investors can count on. It’s cliché to say, but it truly is not a matter of if, but when. How will you react when markets finally turn for the worse? Is your portfolio positioned to weather the storm and keep your long-term investment goals in sight?
At Atlas Private Wealth Management, our job is to prepare clients for market corrections, help them weather the storm when things turn south, and keep their financial plan moving forward. We invite you to meet with your Atlas Private Wealth Management Advisor today and request a portfolio review.
1Morningstar Performance Report. S&P 500 TR USD (Price) return as of 12/13/2017.
2Daily closing price data of the S&P 500 from 1/3/2017, through 12/1/2017, from Yahoo! Finance.
3Based on closing price data of the S&P 500 from Yahoo! Finance.
4Daily closing price data of the S&P 500 from 1/2/2008, through 12/1/2017, from Yahoo! Finance.
5CNBC.com, Most Investors Didn’t Come Close to Beating the S&P 500.
6Monthly closing price data of the S&P 500 from January 1871 through November 2017. Adjusted for inflation using 2017 dollars. Robert Shiller’s online data set, accessible at http://www.econ.yale.edu/~shiller/data.htm.
You may also like